Seaside Debt
ClearDebt’s report Personal Insolvencies in UK Coastal Areas shows coastal areas in the UK are significantly more likely to suffer high rates of insolvency. The report explores why this is the case and whether this situation is likely to change in the foreseeable future.
In total, there are 348 local authorities in England and Wales with only 88 (25%) of these can be considered coastal. Over the last 12 years, personal insolvency rates in England and Wales have been rising.
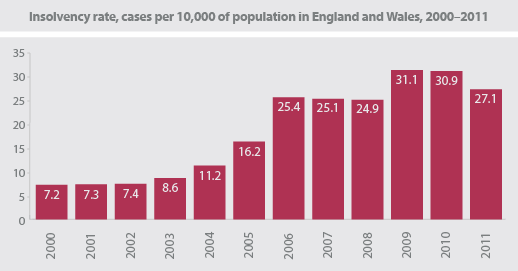
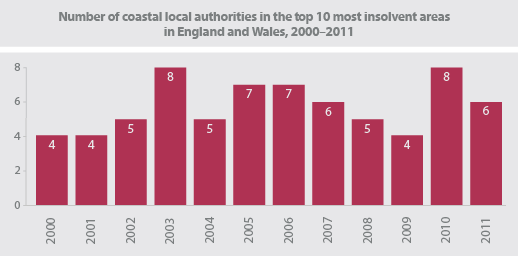
In 2011, 6 of the 10 areas with the highest insolvency rates were coastal
80% of the top ten in 2010 were coastal, while only 25% of all local authorities are coastal.
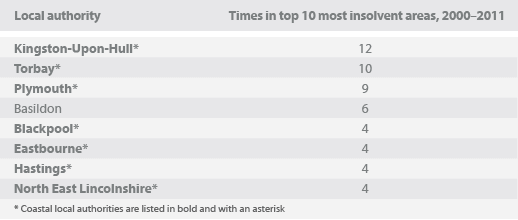
The table below lists local authority areas and the number of times their insolvency rate has been among the top ten highest in England and Wales (since 2000).
With the exception of Basildon, all of the most frequently reoccurring local authorities are located on the coast
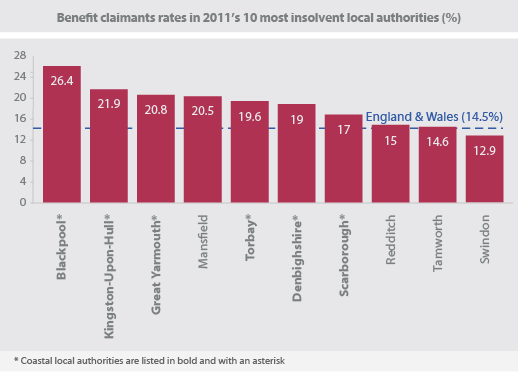
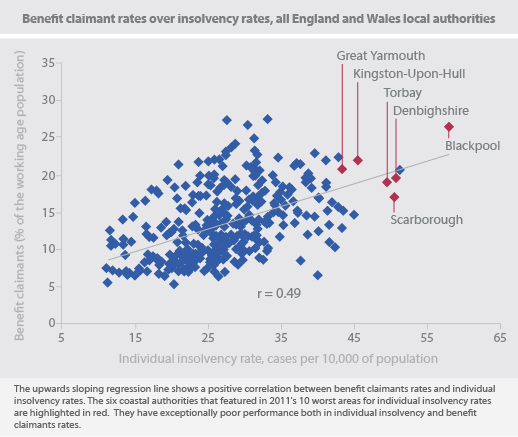
Most of the areas of high insolvency also have high rates of benefit claimants…
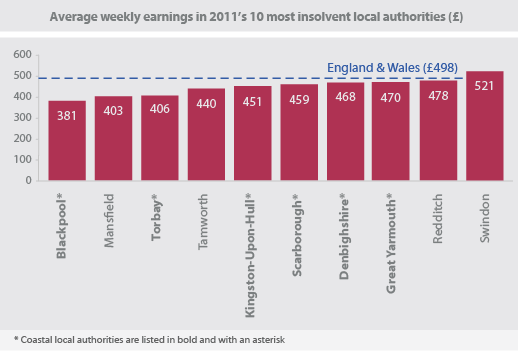
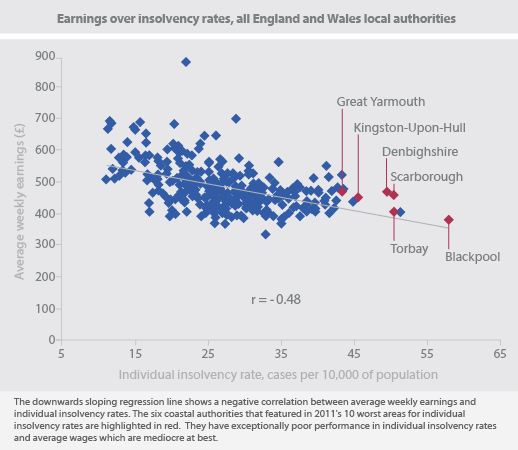
…and low average weekly earnings
High rates of insolvency are generally correlated with high levels of benefit claimants
High rates of insolvency are also inversely correlated with average weekly earnings
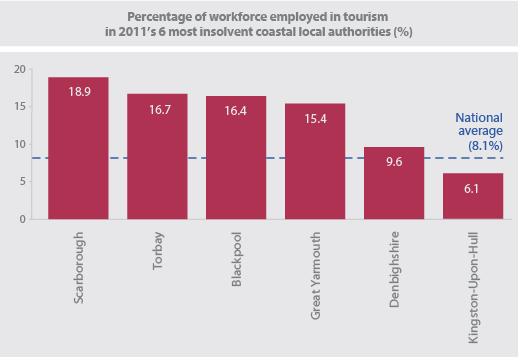
Part of the problems for some coastal towns may be their continued dependency on tourism…
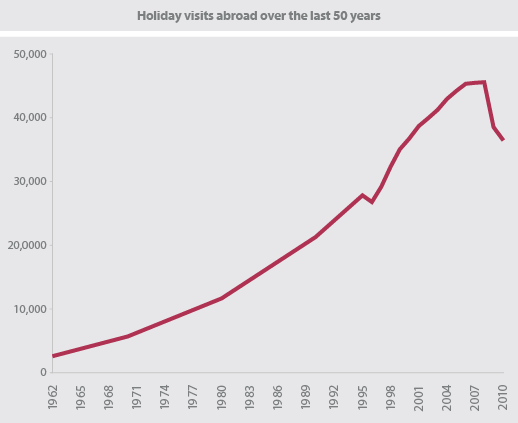
…especially as the general trend (despite a dip since the recession) is for more and more people to holiday abroad
For other coastal towns, it was the loss of key industries like whaling and fishing which has continued to contribute to high personal insolvencies.
However, not all coastal towns are experiencing the same difficulties
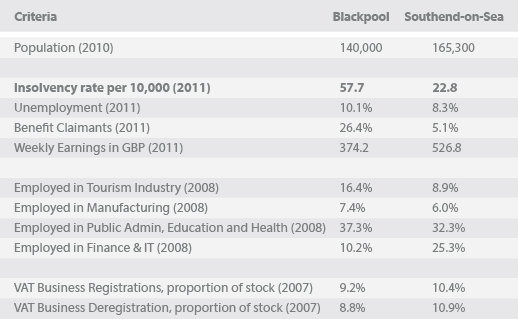
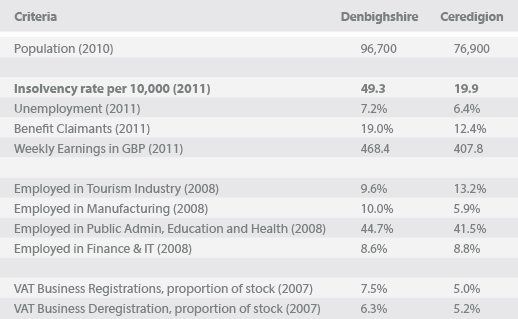
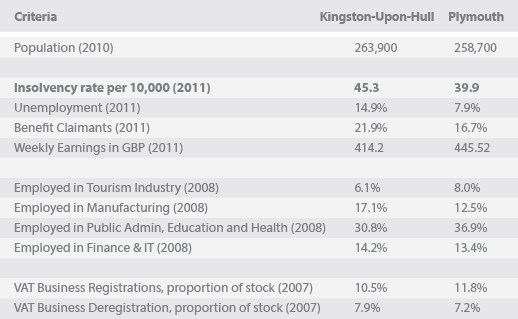
The tables below compare three pairs of coastal authorities in similar geographical situations, but have considerably different economic positions.
So what hope for the future?
The full report compares some of the best and worst performing coastal areas, and identifies organisations seeking to make a difference in these struggling areas.
You can download the full report and all sources are referenced.


